Visualization
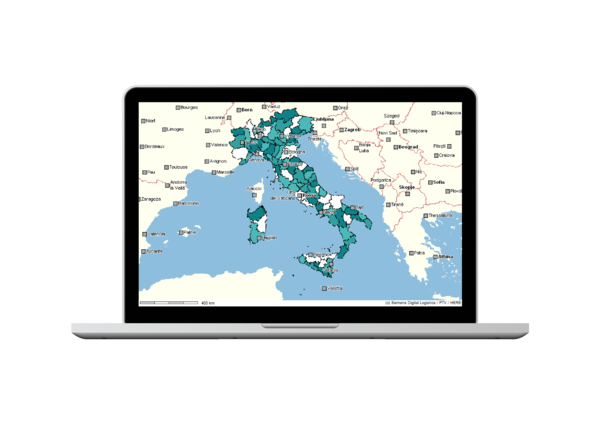
Excel tables for logistics networks sometimes contain thousands of lines of information, making it difficult to keep everything in sight! It is much easier to grasp the whole network by projecting it onto a map
With just one click you can add your customers, suppliers, hubs, and production sites. You can use the map to show the flow of goods, logistical relations, and real and proposed tours, too. Use proportional objects, color choices, and company icons to design map views as you wish.
Visualization features
- Locations and Relations
- Postal Code Areas
- Road Routes
- Quantities and Turnovers in Proportion
- Company Icons
- Reachability Radius
- High-Definition Maps for BRICS Countries